Lesson 40: Apps for controlling external devices
[1]:
import os
import time

import serial
import serial.tools.list_ports

import numpy as np
import pandas as pd

import bokeh_catplot

import bokeh.io
import bokeh.plotting
import bokeh.driving

import panel as pn
pn.extension()

# Change as appropriate for your notebook
notebook_url = 'localhost:8888'

bokeh.io.output_notebook()
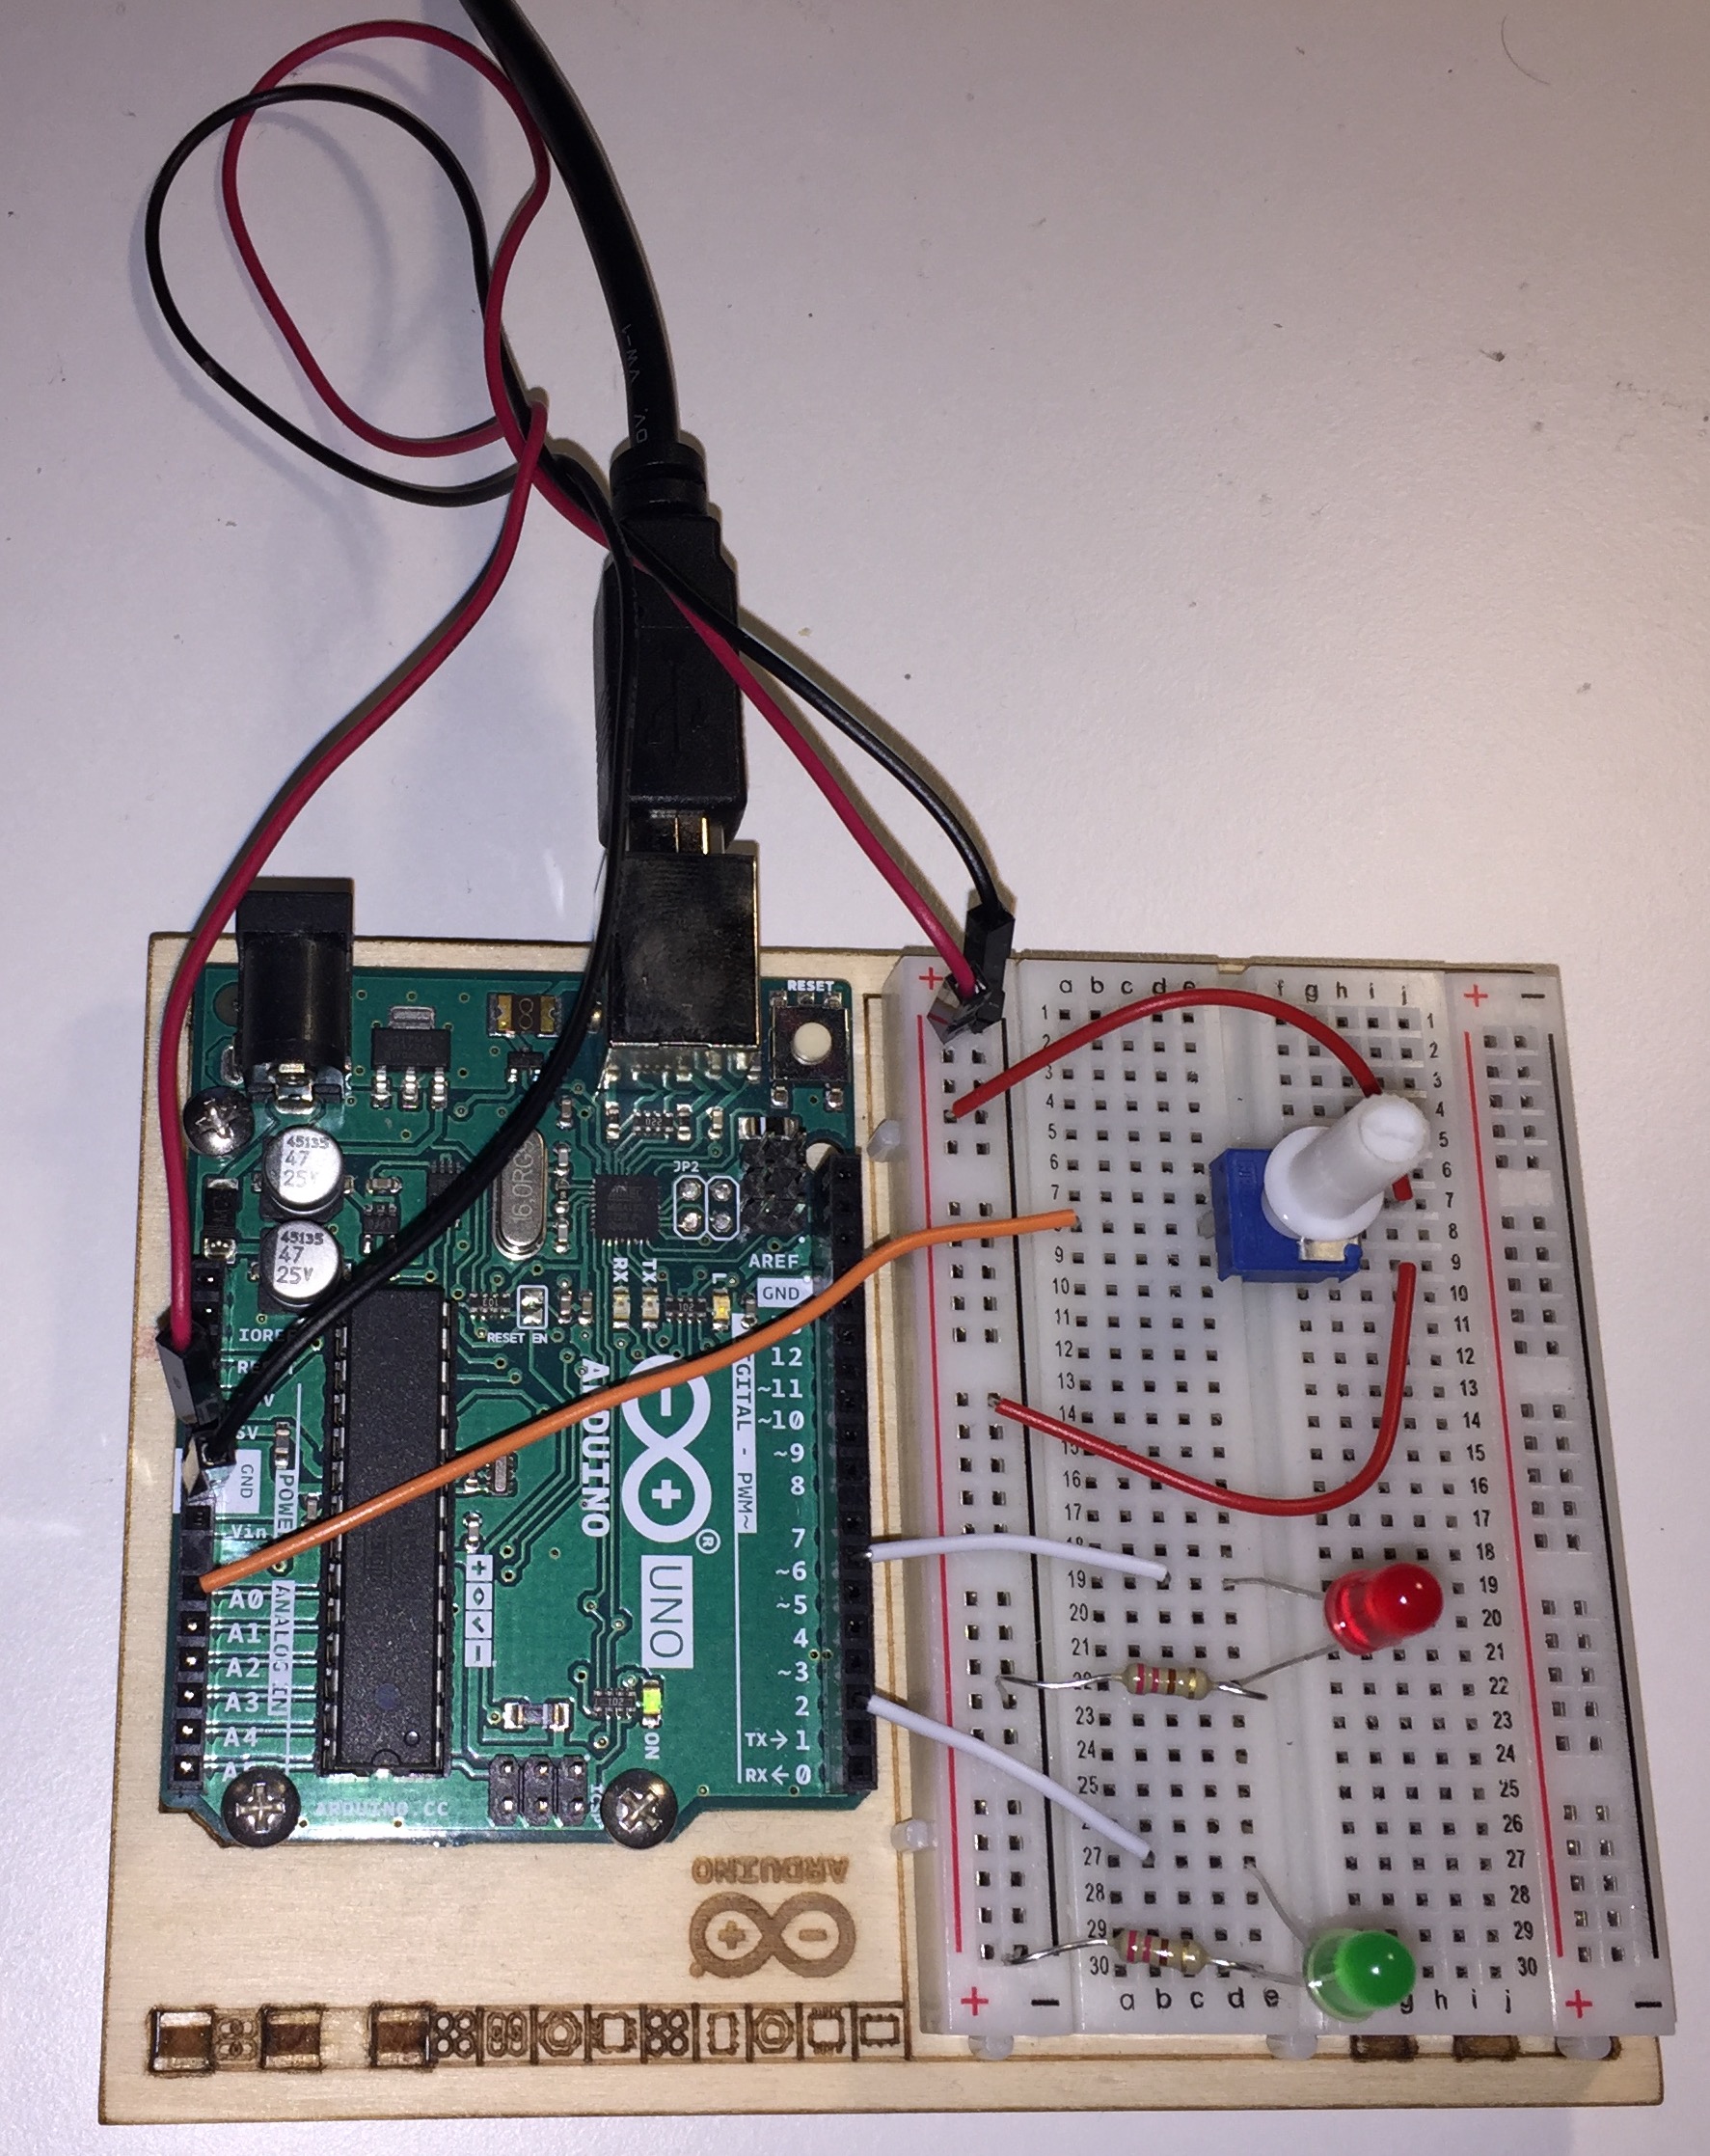
In the previous lesson, we introduced control of external devices using a serial connection. Now, we will build apps to control an external device. You should work through this lesson, is possible, in a running Jupyter notebook with a USB connection to the Arduino shown below. Note that in the HTML rendering of this notebook, several of the interactive plots and apps will not appear.
Arduino
We will use the same device and configurations as in the previous lesson. As a reminder, we are using an Arduino Uno board with the circuit shown below (the resistors are 220 Ω). As with the last lesson, you should actually build the device below and connect it to your computer and run through this lesson in a live Jupyter notebook.
const int voltagePin = A0;

const int redLEDPin = 6;
const int greenLEDPin = 2;

const int VOLTAGE_REQUEST = 1;
const int RED_LED_ON = 2;
const int RED_LED_OFF = 3;
const int GREEN_LED_ON = 4;
const int GREEN_LED_OFF = 5;

const int ON_REQUEST = 6;
const int STREAM = 7;
const int READ_DAQ_DELAY = 8;

String daqDelayStr;

int inByte = 0;
int daqMode = ON_REQUEST;
int daqDelay = 100;

int value;
unsigned long time_ms;


void printVoltage() {
  // read value from analog pin
  value = analogRead(voltagePin);
  time_ms = millis();

  // Write the result
  if (Serial.availableForWrite()) {
    String outstr = String(String(time_ms, DEC) + "," + String(value, DEC));
    Serial.println(outstr);
  }
}


void setup() {
  // Set LEDs to off
  pinMode(redLEDPin, OUTPUT);
  pinMode(greenLEDPin, OUTPUT);
  digitalWrite(redLEDPin, LOW);
  digitalWrite(greenLEDPin, LOW);

  // initialize serial communication
  Serial.begin(115200);

  while (!Serial) ;

}


void loop() {
  // If we're auto-transferring data
  if (daqMode == STREAM) {
    printVoltage();
    delay(daqDelay);
  }

  // Check if data has been sent to Arduino and respond accordingly
  if (Serial.available() > 0) {
    // Read in request
    inByte = Serial.read();

    // If data is requested, fetch it and write it
    if (inByte == VOLTAGE_REQUEST) printVoltage();

    // Switch daqMode
    else if (inByte == ON_REQUEST) daqMode = ON_REQUEST;
    else if (inByte == STREAM) daqMode = STREAM;

    // DAQ delay
    else if (inByte == READ_DAQ_DELAY) {
      while (Serial.available() == 0) ;
      daqDelayStr = Serial.readStringUntil('x');
      daqDelay = daqDelayStr.toInt();
    }

    // else, turn LEDs on or off
    else if (inByte == RED_LED_ON) digitalWrite(redLEDPin, HIGH);
    else if (inByte == RED_LED_OFF) digitalWrite(redLEDPin, LOW);
    else if (inByte == GREEN_LED_ON) digitalWrite(greenLEDPin, HIGH);
    else if (inByte == GREEN_LED_OFF) digitalWrite(greenLEDPin, LOW);
  }
}
According to this code, if we send integers over the serial connection to Arduino, it will behave according to the table below.
signal to Arduino |
action |
|---|---|
1 |
Send voltage from port A0 |
2 |
Turn red LED on |
3 |
Turn red LED off |
4 |
Turn green LED on |
5 |
Turn green LED off |
6 |
Toggle data acquisition mode to on request |
7 |
Toggle data acquisition mode to stream |
8 |
Alert Arduino that the next input is streaming delay |
Again, for convenience, we can declare variables matching these integer codes for this notebook.
[2]:
VOLTAGE_REQUEST = 1;
RED_LED_ON = 2;
RED_LED_OFF = 3;
GREEN_LED_ON = 4;
GREEN_LED_OFF = 5;
ON_REQUEST = 6;
STREAM = 7;
READ_DAQ_DELAY = 8;
Functions from last time
We will put functions we wrote in the previous lesson to use. Here they are for convenience.
[3]:
def find_arduino(port=None):
    """Get the name of the port that is connected to Arduino."""
    if port is None:
        ports = serial.tools.list_ports.comports()
        for p in ports:
            if p.manufacturer is not None and "Arduino" in p.manufacturer:
                port = p.device
    return port


def handshake_arduino(arduino, sleep_time=1):
    """Make sure connection is established by sending
    and receiving bytes."""
    # Chill out while everything gets set
    time.sleep(sleep_time)

    # Set a long timeout to complete handshake
    timeout = arduino.timeout
    arduino.timeout = 2

    # Send request to Arduino
    arduino.write(bytes([1]))

    # Wait for Arduino to respond
    while arduino.in_waiting < 0:
        pass

    # Read in which Arduino sent and ignore it
    _ = arduino.read_until()

    # Reset the timeout
    arduino.timeout = timeout


def open_arduino(port, baudrate=115200, timeout=1):
    """Open a connection with an Arduino device and
    handshake to get ready for use."""
    # Open port
    arduino = serial.Serial(port, baudrate=baudrate, timeout=timeout)

    # Close and reopen
    arduino.close()
    arduino.open()

    handshake_arduino(arduino)

    return arduino


def parse_raw_line(raw_line):
    """Parse bytes output from Arduino."""
    raw_line = raw_line.decode()
    if raw_line[-1] != "\n":
        raise ValueError(
            "Input must end with newline, otherwise message is incomplete."
        )

    t, V = raw_line.rstrip().split(",")

    return int(t), int(V) * 5 / 1023
Before we get going we will first find the port we need to connect to Arduino.
[4]:
port = find_arduino()
Receiving streaming data from Arduino
In the previous lesson, we were able to get data from Arduino on demand by setting up a callback to a button that sent a request for data and then received the data from Arduino. For a great many applications, we want to get a steady stream of data from our device. Fortunately, we have coded up the Arduino code on our device to enable streaming data out of its serial port.
In streaming mode, the Arduino will send a constant stream of data without further input from Python. In this case, the timing is all done on board the Arduino, which is convenient because we can just let it run and receive the data. In this mode, we can also receive data faster, since Arduino does not have to wait for and interpret signals from Python before sending the data.
Let’s now write a function to open a stream and receive data. The function below accomplishes this, and I explain how it does it immediately below.
[5]:
def daq_stream(port, n_data=100, delay=20):
    """Obtain `n_data` data points from an Arduino stream
    with a delay of `delay` milliseconds between each."""
    with serial.Serial(port, baudrate=115200, timeout=0.02) as arduino:
        handshake_arduino(arduino)

        # Specify delay
        arduino.write(bytes([READ_DAQ_DELAY]) + (str(delay) + "x").encode())

        # Initialize output
        time_ms = []
        voltage = []
        i = 0

        # Turn on the stream
        arduino.write(bytes([STREAM]))

        # Receive data
        while i < n_data:
            # Wait for data from Arduino
            while arduino.in_waiting <= 0:
                pass

            # Got something! Read it in.
            raw = arduino.read_until()
            try:
                t, V = parse_raw_line(raw)
                time_ms.append(t)
                voltage.append(V)
                i += 1
            except:
                pass

        # Turn off the stream
        arduino.write(bytes([ON_REQUEST]))

        return np.array(time_ms), np.array(voltage)
In this function, I open the connection, do the necessary handshaking, and then send a message to Arduino about how long of a delay we want between samples. Note that we can only send integers (like all of our messages thus far) up to a value of 255, since we are only reading a byte at a time on the Arduino side. To send a bigger number, I convert it to a string, appended with an “x.” On the Arduino side, this string is read in and converted to an integer. The terminating “x” is important
because I am using Arduino’s Serial.readStringUntil() function to read in characters until I hit a terminating character. I use “x” instead of a newline character because different systems interpret newline characters differently.
I then turn on the stream and receive data until I receive the number of data points I want. Remember that the variable arduino is an instance of a serial connect that has many methods and attributes. The in_waiting function gives the number of bytes that have arrived via the serial connection that have not yet been removed and processed. The while arduino.in_waiting clause waits until Arduino has sent bytes to the computer. Once those bytes are present, I read them in using
arduino.read_until(), which reads in the bytes until hitting a newline byte. I then try to parse the result. If the parsing fails, it means that Arduino sent an incomplete or incoherent message, and I do not want to keep whatever it sent. As I continue to read in data, I parse and store the data in lists for the time and voltage.
When I have received enough data points, I turn off the stream by telling Arduino to switch back to sending data on request.
Note that this is not the fastest way to receive information. I am sending the time and voltage information as strings, with results in more data being sent over the serial port than necessary. I could send them as numbers, but it is easier to handle them as strings, and high speed is not really important for our application here.
Let’s run this function and check out the results. I’ll run it to sample every 20 ms, or sampling at 50 Hz. While I’m running it, I will twist the potentiometer around to change the voltage.
[6]:
t, V = daq_stream(port, n_data=400, delay=20)
Now that we have acquired the data, let’s make a plot!
[7]:
p = bokeh.plotting.figure(
    x_axis_label='time (s)',
    y_axis_label='voltage (V)',
    frame_height=175,
    frame_width=500,
)
p.x_range.range_padding = 0

p.line(t / 1000, V)

bokeh.io.show(p)
We can do a check on roughly how accurately we were able to get data points every 20 millseconds by computing the difference between successive time points (which can be done using np.diff()) and tallying up how many of these differences had different values. This is conveniently done using np.unique() with the return_counts=True kwarg.
[8]:
np.unique(np.diff(t), return_counts=True)
[8]:
(array([20, 21, 22]), array([205, 188, 6]))
So, the timing is pretty good. Roughly half of the time differences were 20 milliseconds and half were 21 milliseconds, with a few at 22 ms.
Apps for data acquisition
The above method for acquiring streaming data is useful for many applications. We call a function, silently read in the data and store it, and when the acquisition is done, we can work with the data. But this can be inconvenient because there is no way to control of visualize the data acquisition once it has started.
Asynchrony
The disadvantage of receiving streaming data from Arduino is that you cannot be using the Python interpreter to do anything else while the data are being received unless you use asynchronous computing, which is possible using the asyncio module. Unfortunately, you cannot current (as of July 2020) use asyncio in JupyterLab because Jupyter has its own event loop running.
In many circumstances, you do not need to use the Python interpreter while acquiring data from a device, as I just mentioned, so this is not a problem. It does preclude remote control of the device during acquisition and live plotting, unfortunately, so we would like to have workaround.
One obvious way is to not use Jupyter. We do not have a lesson on asyncio, and it takes some knowledge of how it works to implement asynchrony. We will not pursue this here, though for more advanced applications it is worth learning.
Another way is to have another Python instance running that can communicate with your device over another serial connection to send (and receive) signals. You can use this other Python instance to stop the stream, for example. This cannot be implemented on an Arduino Uno board because it only has one serial port (though an Arduino Mega board has four).
Another workaround is to use the asynchrony built in to Panel and Bokeh objects. We have actually already done this when we controlled the LEDs with the toggle buttons in the previous lesson. Under the hood, Panel and Bokeh use Tornado to handle their asynchrony. As users, we can take advantage of that without having to get into the guts of how it works.
We will use this last method to build a controllable live apps. We will be sneaky with how we set up the asynchrony, using periodic callbacks from Panel (and then Bokeh) to get data. A periodic callback is a Python function that Panel (or Bokeh) will be in charge of calling at a specified period.
On-request acquisition with toggle and button controls
For our simple first pass at an app, we will use a periodic callback that send a request to Arduino for a data point, receive it, uses the parse_raw_line() we previously wrote to parse it, and then saves the result in time and voltage lists. This will only happen with an “ACQUIRE” toggle is selected. We will also have a “STOP” toggle that will cease data acquisition and do clean-up operations, including turning off the periodic callback, closing the serial connection to Arduino, and writing
the acquired data to disk.
We will start by making or control toggles.
[9]:
acquire_toggle = pn.widgets.Toggle(
    name="ACQUIRE", value=False, button_type="success", width=100,
)

stop_button = pn.widgets.Button(name="STOP", button_type="danger", width=100)
We will also have a static text widget that displays how many data points have been acquired.
[10]:
received_text = pn.widgets.StaticText(
    name="Data points received", value=str(0)
)
We will also have a text widget that gives the status.
[11]:
status_text = pn.widgets.StaticText(
    name="Status", value="Awaiting data acquisition."
)
Next, we write a data acquisition request function. This is the callback that will be called periodically. We should also initialize the time and voltage lists where we will be appending data.
[12]:
time_ms = []
voltage = []

def daq_on_request(event=None):
    """Ask for, receive, and store data from Arduino"""
    if acquire_toggle.value:
        # Update status
        status_text.value = "Acquiring data."

        # Ask Arduino for data
        arduino.write(bytes([VOLTAGE_REQUEST]))

        # Wait for data to arrive
        while arduino.in_waiting < 0:
            pass

        # Read in the data
        raw = arduino.read_until()

        # Parse and add data set
        try:
            t, V = parse_raw_line(raw)
            time_ms.append(t)
            voltage.append(V)
            success = 1
        except:
            success = 0

        # Report that we got another data point
        received_text.value = str(int(received_text.value) + success)
    else:
        status_text.value = "Awaiting data acquisition."
Note that because we acquire data depending on the value of the “ACQUIRE” toggle, we can click the toggle to pause and restart acquisition without starting the acquisition over.
We now need to hook up the periodic callback. We will add a periodic callback to the text widget. For this demonstration, we will use a period of 20 ms, as we did in the data acquisition above.
[13]:
delay = 20

pc = received_text.add_periodic_callback(daq_on_request, period=delay)
Now, we also need a function for the shutdown procedures, including specification of the output file.
[14]:
outfile = 'test_potentiometer_daq.csv'

def shutdown_and_save(event=None):
    """Stop procedures"""
    # Stop the periodic callback
    pc.stop()

    # Disable toggles
    acquire_toggle.value = False
    acquire_toggle.disabled = True
    stop_button.disabled = True

    # Report status
    status_text.value = "Arduino connection closed; app terminated."

    # Close the connection to Arduino
    try:
        arduino.reset_input_buffer()
        arduino.close()
    except:
        pass

    # Write the resulting data out to disk
    pd.DataFrame(data={"time (ms)": time_ms, "voltage (V)": voltage}).to_csv(
        outfile, index=False
    )

    # Reset the lists storing data
    time_ms.clear()
    voltage.clear()
We need to connect this function to the “STOP” button. We can do this using the on_click() method.
[15]:
stop_button.on_click(shutdown_and_save)
We now have the pieces in place! We now can open up a connection to Arduino and lay out our widgets and acquire our data!
[16]:
arduino = open_arduino(port)

pn.Row(
    pn.Column(acquire_toggle, stop_button),
    pn.Spacer(width=15),
    pn.Column(received_text, status_text),
)
Data type cannot be displayed:
[16]:
After hitting “ACQUIRE”, turning the potentiometer knob a few times, and then hitting “STOP”, I got my data. Let’s take a look.
[17]:
df = pd.read_csv('test_potentiometer_daq.csv')

p = bokeh.plotting.figure(
    x_axis_label='time (s)',
    y_axis_label='voltage (V)',
    frame_height=175,
    frame_width=500,
)
p.x_range.range_padding = 0

p.line(df['time (ms)'] / 1000, df['voltage (V)'])

bokeh.io.show(p)
Lovely!
Let’s think for a moment about how we get data from the device. We use Python-based timing to do periodic requests for data. The request is sent over the serial connection to the device. The device parses the request and sends data back over over the serial connection. The data packet is then parsed and processed. This set of operations might result in unreliable timing, since there are lots of operations that happen to get the results.
To check how well we did with timing, we can plot the ECDF of the timing differences.
[18]:
p = bokeh_catplot.ecdf(
    np.diff(df['time (ms)'].values),
    x_axis_label='time between acquisitions (ms)',
)

bokeh.io.show(p)
Yes, the median time between acquisitions is 20 ms, but we do see substantial spread. This may be acceptable for many applications and nothing to worry about. However, we may want to keep the timing of acquisitions as close to our target as possible. That is, we want Arduino to be constantly pushing data out using its timing.
Streaming acquisition with toggle and button controls
We can update our app to receive streaming data by changing the way we read in data. Instead of reading in a single line (that is, a set of bytes that ends with a newline), we can read all of the data that has been sent across the serial connection. The read() method of a Serial instance reads in a set number of bytes. If the prescribed number of bytes are not available, it attempts to read for the amount of time given by the set timeout. Using this behavior, here is our strategy to read
streaming data.
Set a timeout for reading that is short.
Initialize the output to be the bytes we have already read in (the
read_bufferkwarg in the function below).Read in a chunk of data of a given size and append it to the output.
Check the size of the chunk. If it is less than the number of bytes asked for, we hit a timeout, so we know we have read all of the data. Return the output. Otherwise, goto 3.
The function below accomplishes reading in all of the unread data that has been sent over the serial connection.
[19]:
def read_all(ser, chunk_size=100, read_buffer=b"", timeout=0.001):
    """Real all available bytes from serial port
    and append to the read buffer.

    Parameters
    ----------
    ser : serial.Serial() instance
        The devise we are reading from.
    chunk_size : int, default 100
        Size of chunks of streaming data to read in.
    read_buffer : bytes, default b''
        Previous read buffer that is appended to.
    timeout : float, default 0.001
        Timeout for reading in data stream in seconds. It should be
        smaller than the rate of data streaming in because if data
        continues to stream in, the read will continue, posibly
        forever.

    Returns
    -------
    output : bytes
        Bytes object that contains read.
    """
    # Set timeout
    previous_timeout = ser.timeout
    ser.timeout = timeout

    # Read chunk or until timeout
    chunk = ser.read(size=chunk_size)
    out = read_buffer + chunk

    # Keep reading chunks until they're exhausted
    while len(chunk) == chunk_size:
        chunk = ser.read(size=chunk_size)
        out += chunk

    # Reset to previous timeout
    ser.timeout = previous_timeout

    return out
If we are going to use this in our acquisition, we also need to have a parser to convert these longer byte strings to data. For our example with the Arduino potentiometer, the byte strings we read in will looks something like:
b'1032,541\r\n1052,542\r\n1073,554\r\n1093,5'
Recall that the first number is the time in milliseconds and the second number is a voltage, going from 0 to 1023. The \r\n separate individual data pairs. In this case, we have three complete data pairs, but we didn’t quite get the fourth; it got cut off. So, parsing this, we want to add 1032, 1052 and 1073 to our list of times, 541, 542, and 554 to our list of voltages, and store b'1093,5' as the read buffer that we will add to the next time we attempt to read.
Here is a function to do that. We use a try block to ignore anything that does not parse properly.
[20]:
def parse_read(read):
    time_ms = []
    voltage = []

    raw_list = read.decode().split('\r\n')

    for raw in raw_list[:-1]:
        try:
            t, V = raw.split(',')
            time_ms.append(int(t))
            voltage.append(int(V) * 5 / 1023)
        except:
            pass

    return time_ms, voltage, raw_list[-1].encode()
Now that we have these functions, we can rebuild our acquisition app. We’ll start by getting fresh widgets.
[21]:
acquire_toggle = pn.widgets.Toggle(
    name="ACQUIRE", value=False, button_type="success", width=100,
)

stop_button = pn.widgets.Button(name="STOP", button_type="danger", width=100)

received_text = pn.widgets.StaticText(
    name="Data points received", value=str(0)
)

status_text = pn.widgets.StaticText(
    name="Status", value="Awaiting data acquisition."
)
We first have to update our data acquisition function (it’s no longer a request). Note that we need to keep track of the read buffer (the left over stuff from each read that we need to prepend to the next read). To do this, it needs to be mutable, something that can be updated within functions and still used outside. We therefore put the read buffer in a list.
[22]:
read_buffer = [b""]


def daq_stream(event=None):
    """Process a stream of data"""
    if acquire_toggle.value:
        # Wait for data to arrive
        while arduino.in_waiting < 0:
            pass

        # Read in the data
        read = read_all(arduino, chunk_size=100, read_buffer=read_buffer[0])

        # Parse and add data set
        t, V, read_buffer[0] = parse_read(read)
        time_ms.append(t)
        voltage.append(V)

        # Report that we got more data
        received_text.value = str(int(received_text.value) + len(t))
To get data acquisition, we should add a callback to the “ACQUIRE” toggle that turns data streaming on and off from Arduino. This should happen every time the state of the “ACQUIRE” toggle changes. As before, we set up a watcher.
[23]:
def stream_control(event):
    """Turn on the data stream"""
    if event.new:
        status_text.value = "Acquiring data."

        arduino.write(bytes([READ_DAQ_DELAY]) + (str(delay) + "x").encode())
        arduino.write(bytes([STREAM]))
    else:
        arduino.write(bytes([ON_REQUEST]))
        status_text.value = "Awaiting data acquisition."


# Add callback to widget
acquire_watcher = acquire_toggle.param.watch(stream_control, 'value')
Because we are reading in chunks of data and appending chucks to the time_ms and voltage lists, we need to change the shutdown operation to concatenate the results into a single Numpy array before putting them in a data frame.
[24]:
def shutdown_and_save(event=None):
    """Stop procedures"""
    # Stop the periodic callback
    pc.stop()

    # Disable toggles
    acquire_toggle.value = False
    acquire_toggle.disabled = True
    stop_button.disabled = True

    # Report status
    status_text.value = "Arduino connection closed; app terminated."

    # Close the connection to Arduino
    try:
        arduino.reset_input_buffer()
        arduino.close()
    except:
        pass

    # Write the resulting data out to disk
    pd.DataFrame(
        data={
            "time (ms)": np.concatenate(time_ms),
            "voltage (V)": np.concatenate(voltage),
        }
    ).to_csv(outfile, index=False)

    # Reset the lists storing data
    time_ms.clear()
    voltage.clear()


# Connect STOP button to this new function
stop_button.on_click(shutdown_and_save)
Now, we need to connect a periodic callback to our text widget for data acquisition. We will set the delay longer than the delay from streaming, but not so long that we accumulate too much data in the buffer coming from the device. We do not need to ask for every data point when it is sent, and it is easier on the Python side to ask less frequently. So, we will do the periodic callback every 110 ms, while Arduino writes data every 20 ms.
[25]:
pc = received_text.add_periodic_callback(daq_stream, period=110)
Finally, we can open the port and layout the app!
[26]:
arduino = open_arduino(port)

pn.Row(
    pn.Column(acquire_toggle, stop_button),
    pn.Spacer(width=15),
    pn.Column(received_text, status_text),
)
Data type cannot be displayed:
[26]:
Let’s take a look to make sure acquisition went ok.
[27]:
df = pd.read_csv('test_potentiometer_daq.csv')

p = bokeh.plotting.figure(
    x_axis_label='time (s)',
    y_axis_label='voltage (V)',
    frame_height=175,
    frame_width=500,
)
p.x_range.range_padding = 0

p.line(df['time (ms)'] / 1000, df['voltage (V)'])

bokeh.io.show(p)
This looks good. And we should again check the timing. We expect our timing to be better, with 20 or 21 ms between data points.
[28]:
p = bokeh_catplot.ecdf(
    np.diff(df['time (ms)'].values),
    x_axis_label='time between acquisitions (ms)',
)

bokeh.io.show(p)
Indeed, this is what we get!
A primitive app with graphics
While control with buttons is useful, we would like to have a live plot displayed. We can do this using techniques we have learned so far in our dashboarding experience. We can make a function to produce a plot of the voltage trace over time and link it to the widget that gets updated by the periodic callback (in this case the received_text widget).
We’ll start by making fresh widgets and link them to the appropriate callbacks.
[29]:
acquire_toggle = pn.widgets.Toggle(
    name="ACQUIRE", value=False, button_type="success", width=100,
)

stop_button = pn.widgets.Button(name="STOP", button_type="danger", width=100)

received_text = pn.widgets.StaticText(
    name="Data points received", value=str(0)
)

status_text = pn.widgets.StaticText(
    name="Status", value="Awaiting data acquisition."
)

acquire_watcher = acquire_toggle.param.watch(stream_control, 'value')
stop_button.on_click(shutdown_and_save)
Because we are live plotting, and we need to re-render a plot each time we trigger the periodic callback, we will set it up with a half-second period. Otherwise, the plotting cannot keep up with the pace of the periodic updates.
[30]:
# Periodic callback
pc = received_text.add_periodic_callback(daq_stream, period=500)
Next, we’ll make our plotting function and link it to the received_text widget using a @pn.depends decorator as we did in the dashboarding lesson. Recall that the received_text widget will get a periodic callback, so it will get updated every time the callback.
When we make the plot, we will only display the last 400 points, so the plot will roll along with the more updated data as opposed to scrunching the whole signal.
[31]:
@pn.depends(received_text.param.value)
def plot_voltage(dummy_arg):
    p = bokeh.plotting.figure(
        frame_height=175,
        frame_width=500,
        x_axis_label='time (s)',
        y_axis_label='voltage (V)',
        y_range=[-0.2, 5.2],
    )
    p.x_range.range_padding = 0

    try:
        t = np.concatenate(time_ms) / 1000
        V = np.concatenate(voltage)
        ind = -min(len(t), 400)
        t = t[ind:]
        V = V[ind:]
    except:
        t = []
        V = []

    p.line(t, V)

    return p
Now we can open up a serial connection and display our app!
[32]:
arduino = open_arduino(port)

pn.Column(
    pn.Row(
        pn.Column(acquire_toggle, stop_button),
        pn.Spacer(width=15),
        pn.Column(received_text, status_text),
    ),
    pn.Spacer(height=15),
    plot_voltage,
)
Data type cannot be displayed:
[32]:
Having the live plot is nice, but we of course still want all of the data collected from the device. That is still available, as it was written to disk. We can still load it in and plot the entire time series.
[33]:
df = pd.read_csv('test_potentiometer_daq.csv')

p = bokeh.plotting.figure(
    x_axis_label='time (s)',
    y_axis_label='voltage (V)',
    frame_height=175,
    frame_width=500,
)
p.x_range.range_padding = 0

p.line(df['time (ms)'] / 1000, df['voltage (V)'])

bokeh.io.show(p)
And again, we should check to make sure our timing is working out ok.
[34]:
p = bokeh_catplot.ecdf(
    np.diff(df['time (ms)'].values),
    x_axis_label='time between acquisitions (ms)',
)

bokeh.io.show(p)
A performant controllable graphical live app
The performance of the graphics leaves a bit to be desired. The updates are too slow. This is because Bokeh has to re-render an entire plot each time the periodic callback is executed. Preferably, we would only update the data on the plot. It turns out that Bokeh is highly optimized for this.
To do this, though, we must drop down into the lower level graphics of Bokeh and build a Bokeh app. We will use Bokeh alone to generate the toggles, buttons, and callbacks, and will stream the data into the Bokeh plot.
As an example of how a Bokeh app can use a periodic callback for streaming, I build one below to dynamically plot a random walk. The walk will proceed with a dot doing the walk and the trail behind it represented as a line. To build a Bokeh app, we need to write a function the controls the app. The function for the random walker is shown below with an explanation following immediately.
[35]:
def random_walk(doc):
    """Bokeh app for a dynamic random walk of 1000 steps."""
    rg = np.random.default_rng(3252)

    p = bokeh.plotting.figure(
        frame_width=200,
        frame_height=200,
        x_range=[-20, 20],
        y_range=[-20, 20],
    )

    # Use ColumnDataSources for data for populating glyphs
    source_line = bokeh.models.ColumnDataSource({"x": [0], "y": [0]})
    source_dot = bokeh.models.ColumnDataSource({"x": [0], "y": [0]})
    line = p.line(source=source_line, x="x", y="y")
    dot = p.circle(source=source_dot, x="x", y="y", color="tomato", size=7)

    @bokeh.driving.linear()
    def update(step):
        if step > 1000:
            doc.remove_periodic_callback(pc)
        else:
            theta = rg.uniform(0, 2 * np.pi)
            new_position = {
                "x": [source_dot.data["x"][0] + np.cos(theta)],
                "y": [source_dot.data["y"][0] + np.sin(theta)],
            }
            source_line.stream(new_position)
            source_dot.data = new_position

    doc.add_root(p)

    # Add a periodic callback to be run every 20 milliseconds
    pc = doc.add_periodic_callback(update, 20)
The argument of the function (traditionally called doc) is accessed to add any plots (or other Bokeh) to app and to add the callbacks. We first set up the figure and set up the data sources for the dot and for the line. Next, we set up the data sources using Bokeh’s ColumnDataSource. So far in the bootcamp, we have use Pandas data frames as the source for plots. Under the hood, Bokeh automatically converts those to its ColumnDataSource data type. This data type may be dynamically
updated in a Bokeh app, which is exactly what we want. After the data sources are set up, we set up an update function (we call it update() here, but it could have any name). This is what will be called each time the periodic callback triggers. In this case, we decorate the function with @bokeh.driving.linear(). This results in the argument of update, step, being advanced by one every time the function is called. This way we can keep track of how many steps were taken. In the
update function, if we have exceeded the number of desired steps, we cancel the periodic callbacks. Otherwise, we compute the next step of the random walk by computing a random angle for the step. We update the position of the walker by adding the step to it. Finally, we update the data sources for the dot and line. For the line, we use the stream() method. This results in Bokeh only appending new data to the data source instead of pushing through the whole data set for the plot each time.
For the dot, since it is only plotted as a single position, we update the source data to be the dot position.
To run our app, we use bokeh.io.show(). We should also include the URL of the notebook (specified above in the input cell; you can see the URL by looking at the top of your browser).
[36]:
bokeh.io.show(random_walk, notebook_url=notebook_url)
When you run this app, you will see that Bokeh has no problem updating a plot every 20 ms using the stream() method of a ColumnDataSource. We will use this as we build out our app.
Instead of building the app directly, we will write a function that returns an app. This lets us conveniently specify parameters for the app. It takes care of opening and closing the connection with the device, writing to disk, etc.
[37]:
def potentiometer_app(
    port,
    outfile,
    delay=20,
    plot_delay=90,
    rollover=400,
    force_overwrite=False,
):
    """Make a Bokeh app for potentiometer.

    Parameters
    ----------
    port : str
        Location of port for serial connection to Arduino.
    outfile : str
        Path to the file to which data will be written.
    delay: int, default 20
        Delay between data points in milliseconds.
    plot_delay : int, default 100
        Delay between updates of the plot in milliseconds.
    rollover: int, default 400
        Maximum number of data points to show on plot at a time.
    force_overwrite: bool, default False
        If True, overwrite `outfile` if the file already exists.

    Returns
    -------
    app : function
        A function that defines a Bokeh app. To start the app,
        run `bokeh.io.show(app)`.
    """
    if os.path.isfile(outfile) and not force_overwrite:
        raise RuntimeError(f"{outfile} exists, cowardly not overwriting.")

    def app(doc):
        arduino = open_arduino(port)

        # Specify delay
        arduino.write(bytes([READ_DAQ_DELAY]) + (str(delay) + "x").encode())

        # Initialize data arrays
        time_ms = []
        voltage = []

        # Initialize the read buffer
        read_buffer = [b""]

        # Toggles
        acquire_toggle = bokeh.models.Toggle(
            label="ACQUIRE", button_type="success", width=100,
        )

        stop_button = bokeh.models.Button(
            label="STOP", button_type="danger", width=100,
        )

        # Status report
        status_text = bokeh.models.Div(
            text="<b>Status</b>: Awaiting data acquisition.", width=200
        )

        # Callbacks
        def shutdown(new):
            """Stop procedures"""
            # Stop the periodic callback
            doc.remove_periodic_callback(pc)

            # Disable toggles
            acquire_toggle.active = False
            stop_button.disabled = True
            acquire_toggle.disabled = True

            # Close the connection to Arduino
            try:
                arduino.reset_input_buffer()
                arduino.close()
            except:
                pass

            # Write the resulting data out to disk
            df = pd.DataFrame(
                data={
                    "time (ms)": np.concatenate(time_ms),
                    "voltage (V)": np.concatenate(voltage),
                }
            )
            df.to_csv(outfile, index=False)

            # Update status
            status_text.text = (
                "<b>Status</b>: Arduino connection closed; "
                + f"app terminated. {len(df)} data points are "
                + f"stored in {outfile}."
            )

        def stream_control(attr, old, new):
            """Turn on the data stream"""
            if new:
                status_text.text = "<b>Status</b>: Acquiring data."
                arduino.write(bytes([STREAM]))
            else:
                status_text.text = "<b>Status</b>: Awaiting data acquisition."
                arduino.write(bytes([ON_REQUEST]))

        # Link callbacks
        acquire_toggle.on_change("active", stream_control)
        stop_button.on_click(shutdown)

        # Make plot
        p = bokeh.plotting.figure(
            frame_width=500,
            frame_height=175,
            x_axis_label="time (s)",
            y_axis_label="voltage (V)",
            y_range=[-0.2, 5.2],
        )
        p.x_range.range_padding = 0
        source = bokeh.models.ColumnDataSource({"t": [], "V": []})
        r = p.line(source=source, x="t", y="V")

        # Turn on the stream
        arduino.write(bytes([STREAM]))

        @bokeh.driving.linear()
        def update(step):
            if step == 0:
                arduino.reset_input_buffer()
                read_buffer[0] = b""
            elif acquire_toggle.active:
                # Wait for data to arrive
                while arduino.in_waiting < 0:
                    pass

                # Read in the data
                read = read_all(
                    arduino, chunk_size=100, read_buffer=read_buffer[0]
                )

                # Parse and add data set
                t, V, read_buffer[0] = parse_read(read)
                time_ms.append(t)
                voltage.append(V)

                # Update plot
                source.stream(
                    {"t": np.array(t) / 1000, "V": V,}, rollover,
                )

        doc.add_root(
            bokeh.layouts.row(
                p,
                bokeh.layouts.Spacer(width=15),
                bokeh.layouts.column(acquire_toggle, stop_button, status_text),
            )
        )

        # Add a periodic callback to be run every `plot_delay` milliseconds
        pc = doc.add_periodic_callback(update, plot_delay)

    return app
This app has several bits of syntax you haven’t seen before. Essentially, we’re building a layout and linking up callbacks using Bokeh directly instead of Panel. Based on what you already know from the bootcamp and what you’ve already seen in this lesson, the code above should be self-explanatory. A couple key points of note:
Instead of setting up a watcher like we do with Panel, we use an the
on_change()method of a toggle widget. The callback function for on-change behavior must have call signaturecallback(attr, old, new), whereattris an attribute of the widget,oldis the pre-change value of that attribute, andnewis the post-change value of the attribute.There is now plain text widget for Bokeh. Instead, we use a
Divobject to make a div, into which we can insert text that will be interpreted as HTML.We have to add the layout to the
docusing theadd_root()method. Similarly, a periodic callback has to be added to thedoc.
One other point of note is that I choose a default plot_delay of 90 ms. I find that ten updates per second is fine for the human eye to perceive; there is no reason to go faster, though we could.
Now that we’ve built it, let’s see it in action!
[38]:
bokeh.io.show(
    potentiometer_app(port, "test_potentiometer_daq.csv", force_overwrite=True),
    notebook_url="localhost:8888",
)
Conclusions
By using Bokeh’s and Panel’s built-in asynchrony, we can collect streams of data from Arduino. If we want hight responsive plot updating, we need to dig a bit into the lower-level plotting library, in this case Bokeh. For many devices, though, data acquisition is not that fast, and updates every second or so are plenty fast, and you can build the app entirely with Panel’s high-level functionality.
The apps we built here function in a notebook. You can read here about how to serve the app up on a static website. This would be a good exercise for you in reading documentation to build your own stand-alone browser-based app for controlling an external device.
Computing environment
[39]:
%load_ext watermark
%watermark -v -p numpy,pandas,serial,bokeh,panel,bokeh_catplot,jupyterlab
CPython 3.7.7
IPython 7.16.1

numpy 1.18.5
pandas 0.24.2
serial 3.4
bokeh 2.1.1
panel 0.9.7
bokeh_catplot 0.1.8
jupyterlab 2.1.5